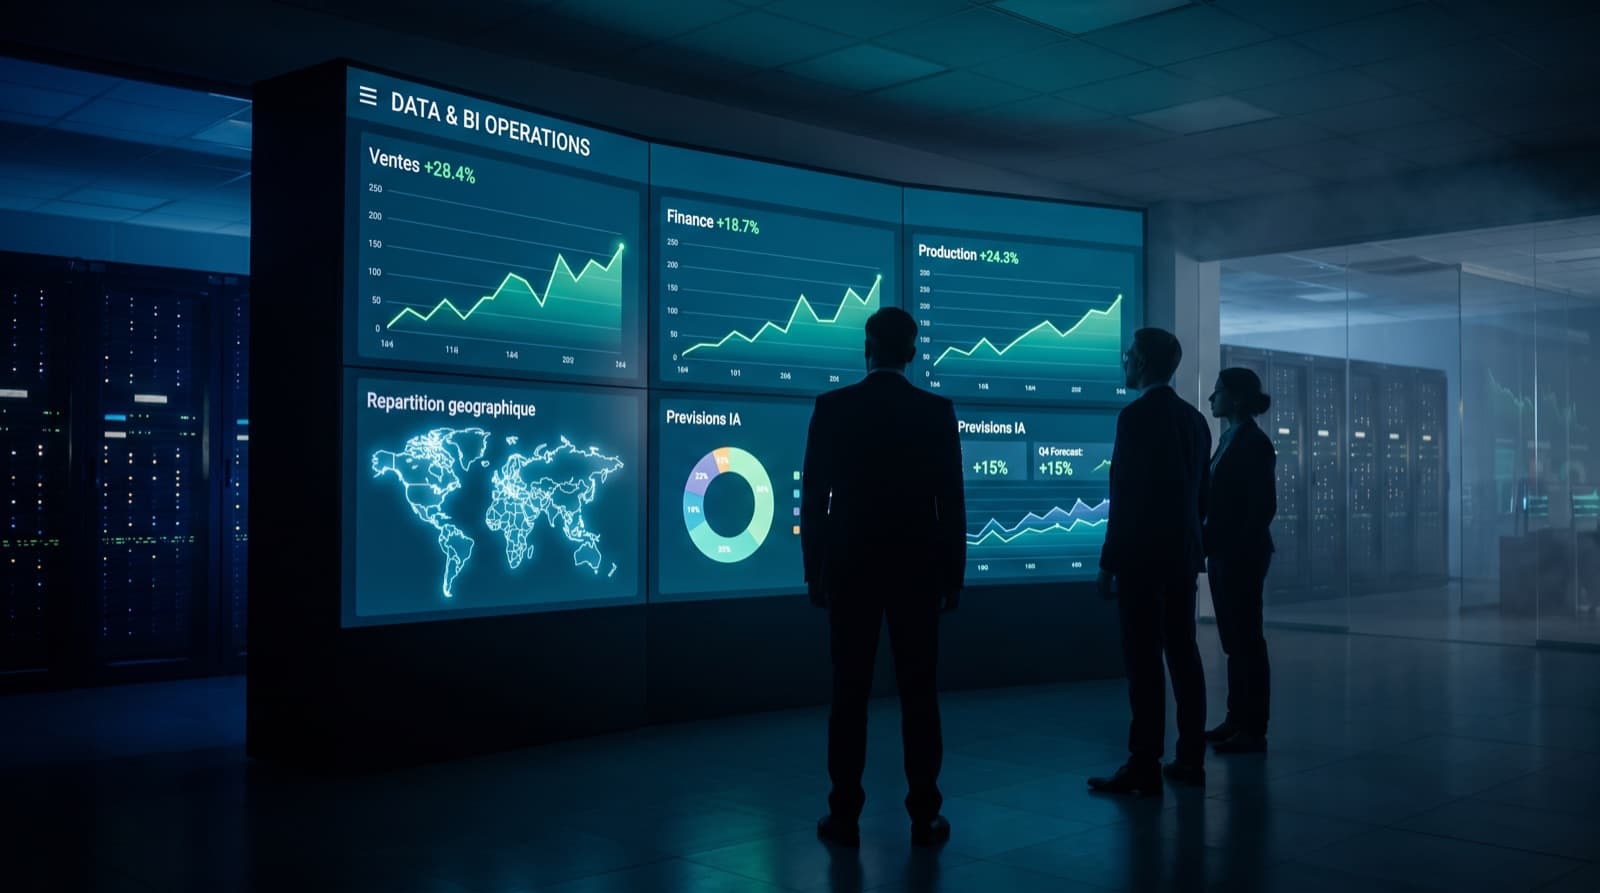
Data & BI
Your data already knows. Make it talk.
Reliable figures, in one place, read the same way by everyone: we build the full decision chain — collection, warehouse, dashboards — and prepare it for AI.
In brief
Business intelligence turns your operational data — ERP, CRM, tills, production — into reliable, shared indicators. Hunter BI builds the full chain: extraction pipelines, a structured data warehouse, Power BI or open-source dashboards, and documented KPI definitions. That foundation then serves AI: a clean warehouse is the best base for agents that answer your business questions in natural language.
What we build
The full chain, from source system to boardroom
Four workstreams in sequence — and a foundation that then serves AI.
Dashboards & KPIs
Power BI, Metabase or Apache Superset depending on your environment and budget. Dashboards by role — leadership, finance, operations — with written, shared KPI definitions: one figure, one way to compute it.
Data warehouse & pipelines
Extraction from your systems (Odoo, SAP, e-commerce, files), versioned transformations, loading into a structured warehouse — PostgreSQL, BigQuery or a sovereign equivalent depending on your data-residency constraints.
Data quality & governance
Automated quality tests (freshness, completeness, consistency), a data catalogue, role-based access and full traceability. A dashboard is only worth what you can trust it to display.
AI on your data
The natural next storey: agents that query the warehouse in natural language — "what was our margin in the North region this quarter?" — with answers sourced from your KPI definitions, never improvised figures.
The decision chain
From raw data to the boardroom figure
A reliable dashboard is the visible end of a chain: extraction from your systems, versioned and tested transformations, a structured warehouse, documented KPI definitions. We build that chain in that order — it is what makes a displayed figure a figure you can trust.

›elt run sales --daily
extract: odoo · tills · e-commerce — OK
transform: 14 dbt models · versioned · tested
tests: freshness OK · completeness OK · 0 gaps
load: warehouse → dashboards refreshed
The AI foundation
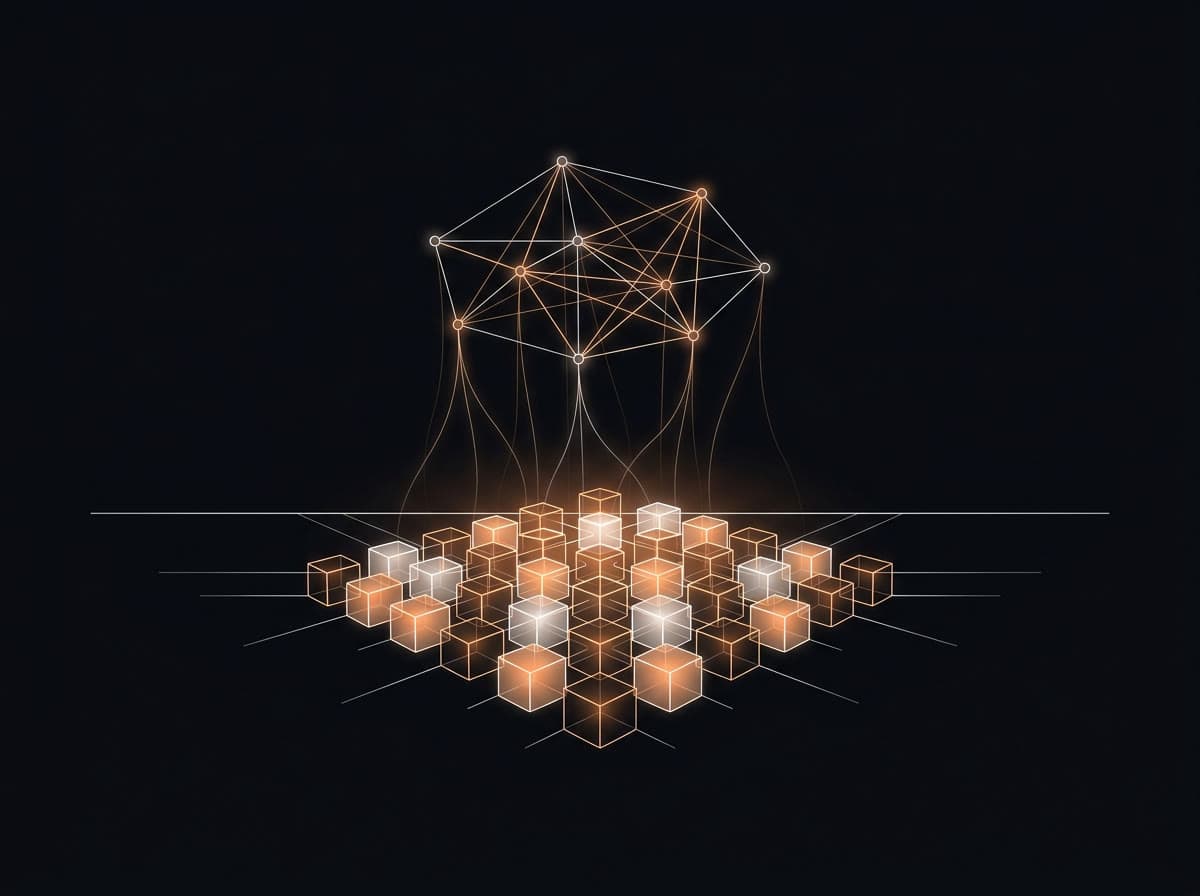
A clean warehouse is the best AI foundation
AI agents that answer correctly rely on governed data: the same tables, the same calculation rules as your dashboards. As we build your BI, we prepare that foundation — documented schemas, shared definitions, controlled access — so the AI storey (natural-language questions, assisted analysis) lands without improvisation.
Quality & governance
A wrong figure costs more than no figure
Every pipeline ships with its tests: data freshness, completeness, cross-source consistency. KPI definitions are written and shared — finance and operations read the same figure the same way. And access is governed by role: everyone sees their scope, and the audit trail shows who saw what.

The tools
Chosen for your context, not out of habit
Power BI in Microsoft environments, Metabase or Superset when open source makes sense, PostgreSQL or BigQuery depending on scale: we frame the choice on your criteria — total cost, hosting, in-house skills.
Power BI
The reference in Microsoft environments: Teams and SharePoint distribution, scheduled refreshes, Azure AD governance.
Metabase
Pragmatic open source: click-to-question, shared boards, self-hostable — ideal to start fast without per-seat costs.
Apache Superset
Open source for data teams: native SQL, rich visualisations, fine-grained access control — for organisations industrialising.
PostgreSQL
The safest starting warehouse: robust, sovereign if needed, and sufficient far longer than people expect.
BigQuery
The cloud warehouse at scale: massive queries with no administration, close to your Google Cloud pipelines where relevant.
dbt
Transformations as code: versioned, tested, documented — every KPI has a readable definition and a git history.
Frequently asked
Power BI or open source (Metabase, Superset)?
Power BI is often the natural fit in Microsoft 365 environments: bundled licences, Teams distribution, Azure AD governance. Metabase or Superset make sense when you want to control per-seat costs, host on your own infrastructure or stay vendor-independent. We work with both families and frame the choice on your criteria — total cost, hosting, in-house skills.
Our data is scattered and of uneven quality — where do we start?
That is the most common starting point, and it is precisely the work: a short audit maps your sources, measures actual quality and identifies the three indicators that matter most to how you steer the business. We build the chain on that narrow scope first — sources, warehouse, first dashboard — then widen. Waiting for perfect data before starting is the surest way never to start.
How long until a first reliable dashboard?
Six to ten weeks for a first complete chain: KPI scoping, source connections, warehouse, tested transformations and a dashboard in production. Later iterations move much faster — the infrastructure and definitions are in place.
How does BI relate to your AI services?
BI is the foundation; AI is the storey above. A structured warehouse with documented KPI definitions enables AI agents that answer correctly: they rely on the same tables and the same calculation rules as your dashboards. Plugging a model into ungoverned data produces plausible but wrong answers — which is why we often start with the data.
Can our data stay in Morocco?
Yes. The warehouse can be hosted on infrastructure in Morocco or in a cloud with your chosen data residency, and the chain also runs in sovereign environments — see our sovereign AI offer. Law 09-08 and your sector requirements shape the architecture from the scoping phase.

// data audit — two weeks
Your figures deserve better than an Excel export. A steering wheel.
- 01A map of your sources
- 02A measure of actual quality
- 03The 3 indicators to fix first
Reply within one business day · Free diagnostic, no commitment · Member of the OpenAI and Anthropic partner networks